
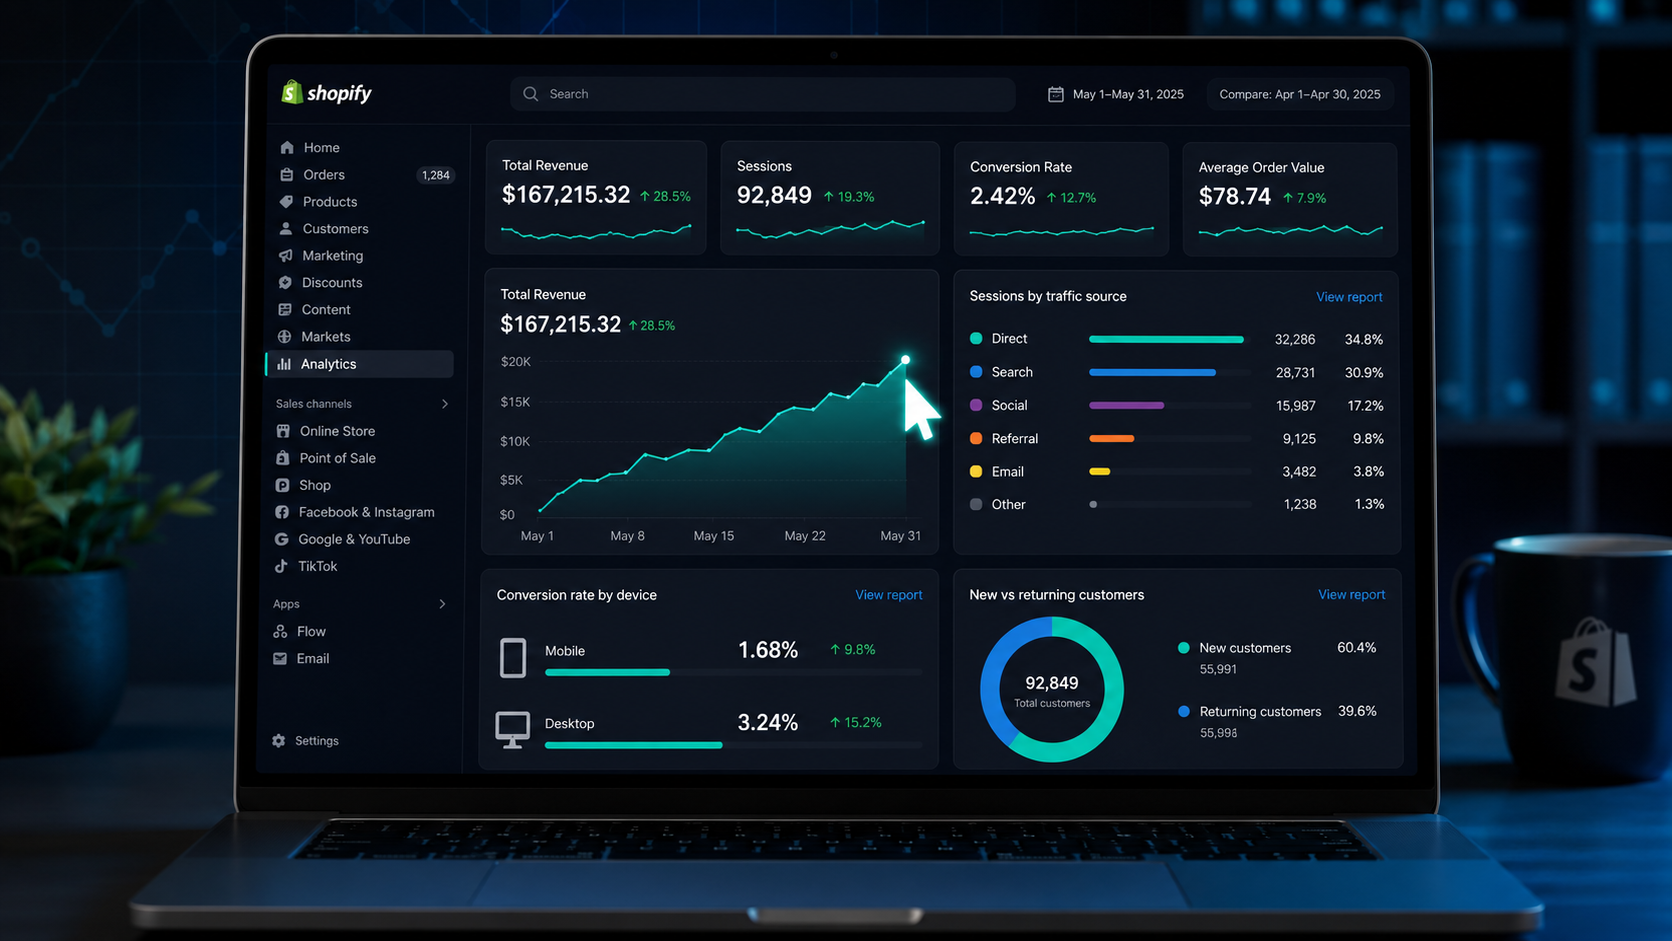
How to Read Your Data and Make Decisions That Grow shopify Revenue
Most Shopify store owners check their analytics the same way — they open the dashboard, glance at today's revenue number, compare it to yesterday, feel good or feel anxious based on that comparison, and close the tab. Real Way to check How to Read Your Data and Make Decisions That Grow shopify Revenue.
That is not analytics. That is scoreboard watching.
Real analytics is the practice of turning numbers into decisions. It is asking specific questions — why did conversion rate drop on mobile last Tuesday, which traffic source produces customers with the highest lifetime value, does offering free shipping above $75 actually increase average order value or just reduce margin — and then using your data to answer them.
The merchants who grow consistently in 2026 are not the ones with the most data. They are the ones who have built the habit of asking the right questions and using Shopify's reporting tools to answer them systematically. Ruby Friel, founder of Still Life Story, grew her store's revenue by 50% year over year during the Christmas period by using Shopify analytics to identify bestsellers and sales trends before competitors could react to them.
This guide covers every report category in Shopify Analytics, which metrics actually drive decisions, how to interpret what you see, and the specific questions your data should be answering every week.
Understanding What Shopify Analytics Can and Cannot Tell You
Before diving into individual reports, establishing the boundaries of what Shopify Analytics covers prevents the frustration of looking for insights the platform is not designed to provide.
Shopify Analytics covers approximately 80% of what most merchants need for day-to-day operational decisions — sales performance, traffic and acquisition, product and inventory data, customer behavior, and marketing channel performance. It is genuinely comprehensive for stores under $1 million in annual revenue and remains highly useful for stores well beyond that threshold.
The 20% it does not cover natively includes customer lifetime value connected to marketing spend, contribution margin by acquisition channel, cohort analysis tied to specific campaigns, and cash conversion cycle analysis. These require blending Shopify data with ad platform data and accounting system data — either manually, through Google Looker Studio, or through third-party analytics platforms like Triple Whale, Polar Analytics, or Lifetimely.
The other important limitation to understand is attribution. Shopify uses last-non-direct-click attribution — it credits the last traffic source a customer came from before purchasing, excluding direct visits. Meta and Google both use their own attribution models that count view-through conversions and have different lookback windows. This is why your Shopify revenue number, your Meta reported revenue, and your Google reported revenue never match. None of them is wrong — they are measuring different things. Pick one as your source of truth for revenue reporting and use the others directionally.
With those boundaries established, here is everything Shopify Analytics is excellent at.
Navigating Shopify Analytics: The Report Categories
In your Shopify admin, go to Analytics and then Reports. You will see six primary report categories. Each answers a different set of business questions.
Sales Reports
Sales reports are the foundation of Shopify Analytics and the starting point for understanding what is actually happening in your business. They cover total sales, net sales, average order value, discounts applied, refunds issued, taxes collected, and revenue trends over time.
The sales over time report is most useful when viewed with a comparison period active. Switch from the default single-period view to the comparison view and select the same period from the previous year. If your revenue is growing month over month but declining year over year, your business has a structural problem that month-to-month comparisons will not reveal.
Sales by product is one of the highest-value reports in the entire platform. It shows exactly which products are generating revenue, which are generating returns, and which are not moving at all. Sorted by net sales descending, this report immediately reveals your top-performing SKUs — and sorted by return rate, it reveals which products are creating operational cost and potential customer dissatisfaction that your revenue reports alone would not surface.
Sales by traffic source shows revenue attributed to each acquisition channel — organic search, paid social, email, direct, referral. This report answers the question your paid advertising dashboard never will: how much revenue is this channel actually producing in Shopify's attribution model? Compare it to your channel spend to get a rough channel-level ROAS that you can use alongside platform-reported numbers.
Sales by channel matters for merchants selling across multiple surfaces — online store, TikTok Shop, Instagram Shopping, or physical retail via Shopify POS. It shows exactly what each channel contributes so you can allocate effort and investment proportionally to actual revenue generation.
Customer Reports
Customer reports answer the retention question — the one that determines whether your business is building durable value or running on an acquisition treadmill.
The new versus returning customers report is the most important retention metric in Shopify Analytics. If your new customer percentage is consistently above 80%, your business is heavily dependent on continuous acquisition spending. If new customer percentage is below 60%, your existing customers are returning frequently — which is a strong signal of product quality and retention program effectiveness.
Customer cohort analysis shows what percentage of customers who made their first purchase in a given month came back to make a second, third, or subsequent purchase. This is the metric that connects your acquisition investment to your long-term profitability. A customer acquisition cost of $40 looks very different against a customer who purchases twice compared to one who purchases eight times.
The math is straightforward and worth calculating explicitly: if your customer acquisition cost is $40 and your average order value is $50, you are acquiring customers profitably on the first purchase only if your margins are above 80%. If margins are 40% — which is more typical for physical goods — you need that customer to purchase at least three times before the acquisition investment returns a profit. Your cohort analysis tells you whether that is actually happening.
Customers by location is useful for two decisions: determining which geographic markets to invest in with localized advertising, and informing your shipping and fulfillment strategy. If 30% of your customers are in a single metropolitan area, same-day delivery options in that area may be more strategically valuable than they would appear from aggregate data.
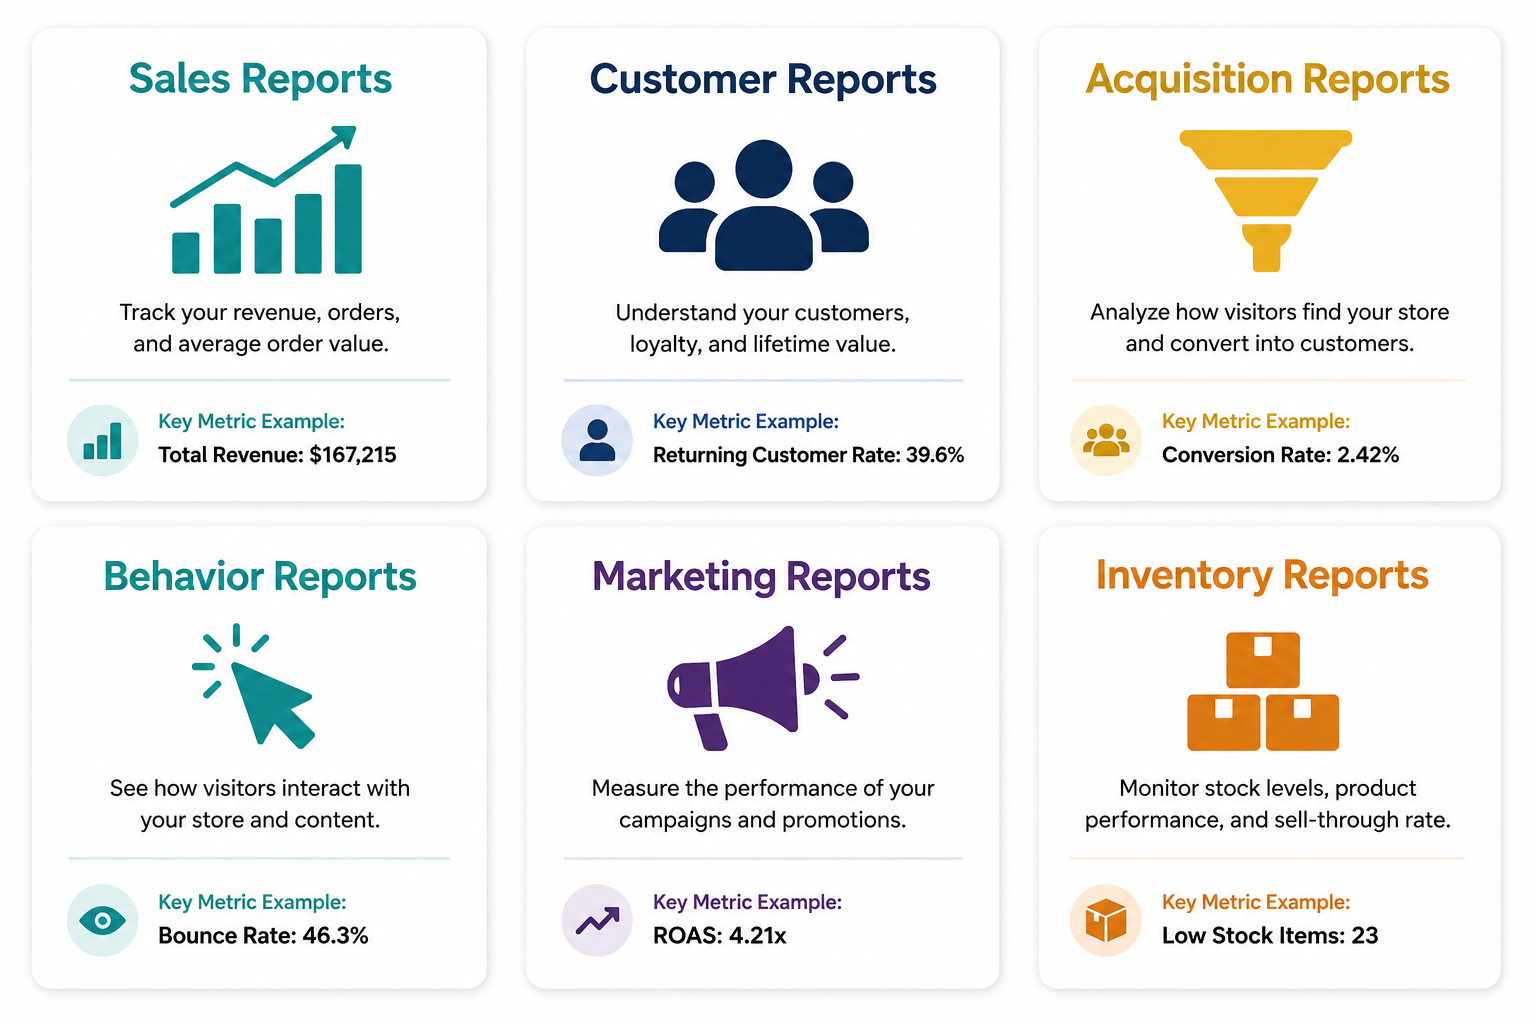
Acquisition Reports
Acquisition reports show where your visitors are coming from and how those sources convert — not just which channels drive the most traffic, but which channels drive traffic that actually buys.
Sessions by traffic source combined with conversion rate by traffic source is one of the most actionable report combinations in Shopify Analytics. Traffic volume from a source tells you reach. Conversion rate from that source tells you quality. A source sending 5,000 sessions per month at 0.8% conversion rate is generating 40 orders. A source sending 800 sessions at 4.2% conversion rate is generating 34 orders. The second source is nearly as productive at one-sixth the traffic — meaning investment in scaling it would likely produce better returns than scaling the first.
Sessions by device reveals the mobile-desktop conversion gap that is present in virtually every Shopify store. When you see that mobile sends 74% of your sessions but generates only 55% of your revenue, you are looking at a mobile conversion rate that is significantly below your desktop rate. That gap is a prioritized optimization opportunity — not a traffic quality problem but a mobile experience problem that product page and checkout optimization can address directly.
Sessions by landing page shows which pages are generating the most traffic and which traffic-generating pages convert at the highest rates. A blog post driving significant organic traffic that converts at 0.3% suggests a content-to-product funnel problem. A collection page converting at 4.1% from paid traffic suggests that landing page is particularly well-matched to its ad creative.
Behavior Reports
Behavior reports reveal how visitors move through your store — which pages they visit, where they stop, and what path leads to purchase.
Online store sessions by page tells you which pages receive the most visits. Cross-referenced with your sales reports, this reveals which high-traffic pages are converting and which are not. A product page in your top five by traffic volume that does not appear in your top ten by revenue is a conversion gap worth investigating.
Top online store searches shows what customers are typing into your store's search bar. This report is one of the most underused in Shopify Analytics and one of the most valuable. Customers who use your search function are higher-intent buyers than passive browsers — they are actively looking for something specific. What they search for tells you what they expect to find. Common search terms for products you do not carry represent product sourcing opportunities. Common search terms that return poor results represent navigation problems worth fixing.
Cart abandonment rate by device — available through the behavior reports combined with checkout reports — typically shows a 10 to 15 percentage point gap between mobile and desktop abandonment rates. This gap confirms that checkout friction, not product-level hesitation, is the primary driver of mobile abandonment for most stores.
Marketing Reports
Marketing reports cover the performance of your Shopify-native marketing activities — email campaigns sent through Shopify Email, automated discount campaigns, and attribution from connected marketing channels.
The marketing attribution report shows which channels are credited with influencing purchases under Shopify's last-non-direct-click model. For merchants running multiple channels simultaneously — paid social, email, organic, paid search — this report gives you a Shopify-side view of channel contribution that differs from what each platform claims independently. Neither is the complete truth, but seeing both helps triangulate where your marketing investment is actually working.
Email campaign performance within Shopify — for merchants using Shopify Email rather than Klaviyo — shows open rates, click rates, and attributed revenue per campaign. The benchmark to beat for Shopify Email campaigns in 2026 is 20 to 25% open rate and 2 to 3% click rate. Campaigns below these thresholds typically indicate either a list quality problem, a subject line problem, or a send time problem — all of which are fixable with systematic testing.
Inventory and Product Reports
Inventory reports prevent two of the most expensive operational mistakes in ecommerce: stockouts on your bestsellers and dead stock on your slow movers.
Days of inventory remaining is the most important inventory report for operational planning. It shows how many days of stock remain for each SKU based on current sales velocity. Products showing under 14 days of remaining inventory while your supplier lead time is 21 days are already in a stockout risk scenario that requires immediate action. Products showing 180 or more days of remaining inventory at current velocity represent capital tied up in stock that is not moving — a cash flow problem that the revenue reports alone will not reveal.
ABC inventory analysis — available through third-party apps including Report Pundit and Inventory Planner — categorizes your products into three tiers: A products that generate 70 to 80% of revenue from approximately 20% of SKUs, B products in the middle tier, and C products that represent 50 to 60% of your SKUs while generating only 5 to 10% of revenue. This categorization tells you where to focus restocking priority, which products to feature in marketing, and which slow-moving SKUs to consider discounting or discontinuing.
The Four Metrics That Drive Weekly Decisions
Shopify Analytics surfaces dozens of metrics. Four of them should be reviewed every week by every Shopify merchant regardless of store size or category. These four drive the majority of actionable decisions at any growth stage.
Conversion rate by traffic source is the primary diagnostic for where your store is winning and losing customers. Track this weekly by device and by acquisition channel. Any sustained decline in conversion rate from a specific source that does not correlate with a change in that source's audience quality signals a landing page problem, a product problem, or a price competitiveness problem specific to that channel's audience.
Average order value over time tells you whether your upsell, cross-sell, and bundling strategies are working. If you implement Frequently Bought Together recommendations and your AOV does not move in the following four weeks, the recommendations are either irrelevant, poorly placed, or both. AOV is the metric most directly influenced by on-site changes — making it the best signal for evaluating product page and cart optimization work.
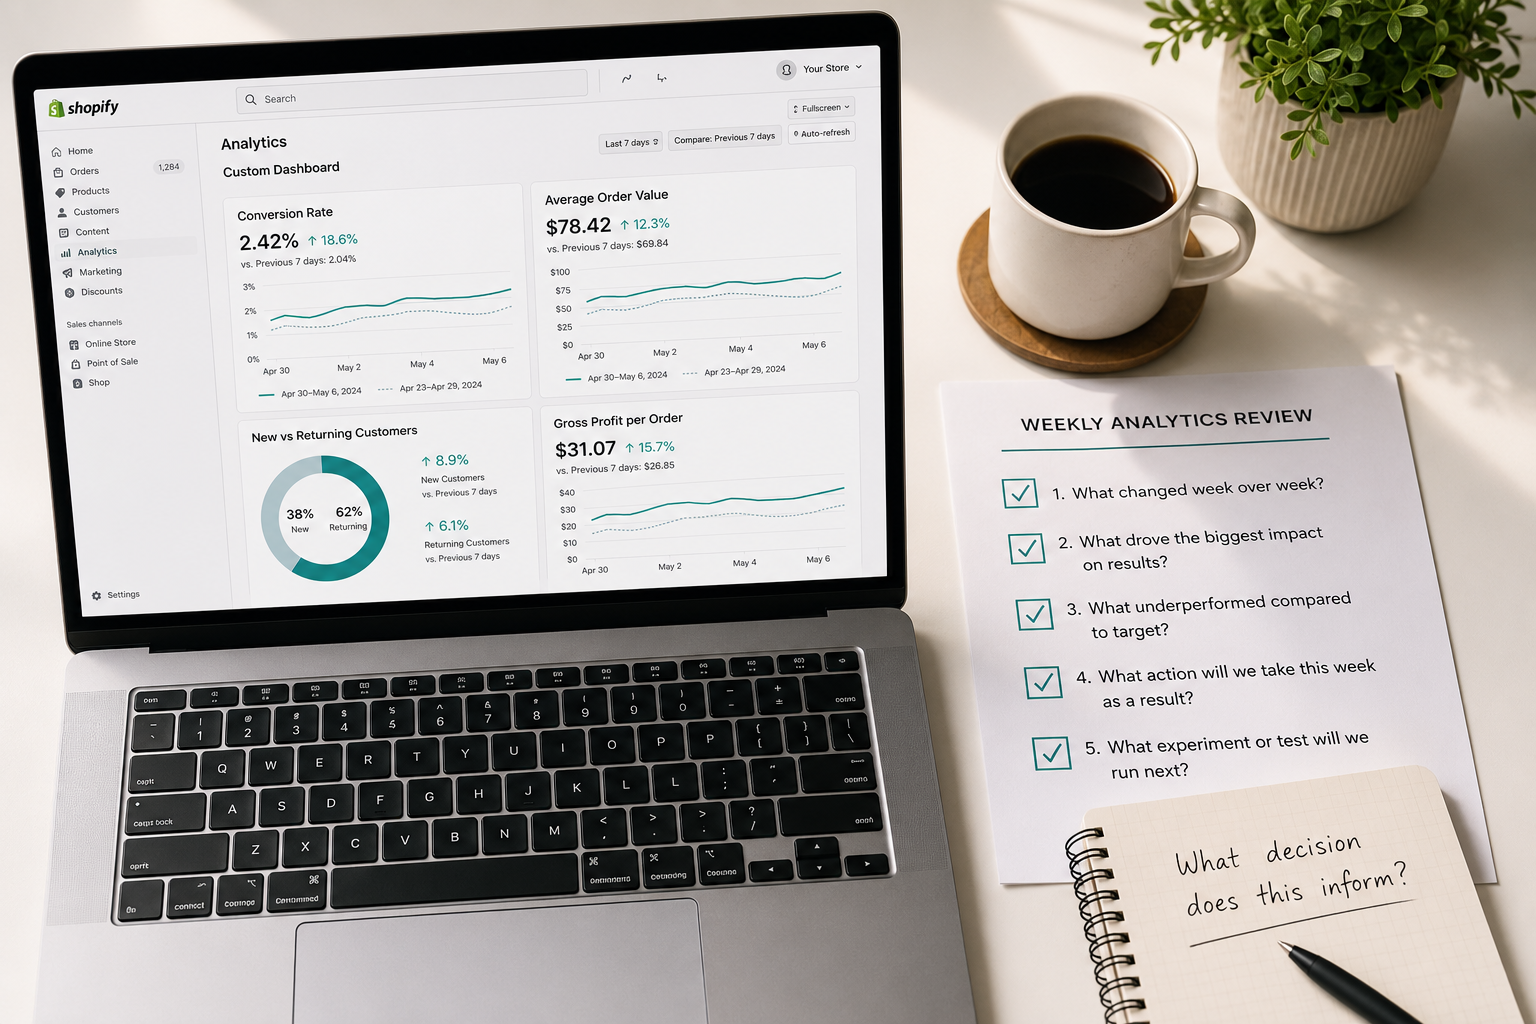
New versus returning customer ratio tells you whether your retention is improving or declining as your business grows. The healthiest Shopify stores in 2026 show a returning customer percentage that increases as the business matures — meaning each cohort of new customers acquired is being retained at higher rates than previous cohorts. If your returning customer percentage is declining as your revenue grows, your growth is increasingly dependent on expensive acquisition rather than compounding retention.
Gross profit per order — available on Advanced Shopify and Shopify Plus plans, or approximated on lower plans by tracking cost of goods sold manually — is the metric that separates revenue growth from profitable growth. A store growing revenue at 40% year over year while its gross profit per order is declining is building a revenue number that does not reflect business health. Tracking gross profit per order alongside revenue prevents the common trap of scaling a business that is growing its way to a lower margin.
How to Build a Weekly Analytics Review Practice
The goal of analytics is not to produce reports. It is to answer questions that lead to decisions. A weekly analytics review structured around specific questions takes 20 to 30 minutes and produces more actionable insight than hours of dashboard watching.
The weekly review framework:
Revenue vs. last week and last year — is growth on track? If revenue is up week over week but down year over year, what changed? Was last year's comparable week inflated by a promotion? Is this year's organic traffic down? Is a specific channel underperforming?
Conversion rate by device — has mobile conversion rate changed? If it dropped, check if there were any theme changes, app additions, or new products with incomplete information that went live that week. Conversion rate changes that correlate with specific site changes are immediately actionable. Changes with no obvious correlating cause require deeper investigation into sessions by page and cart abandonment data.
Top products this week vs. last week — is your revenue concentration shifting? If a product that was in your top five by revenue last week has dropped out this week, is it because it sold out, because an ad driving traffic to it paused, or because conversion rate on that product page declined? Each answer points to a different intervention.
New vs. returning customer split — is the ratio moving? If returning customer percentage declined significantly this week, is it because new customer acquisition spiked — which would be positive — or because returning customer purchase frequency dropped — which would indicate a retention problem?
Traffic source conversion rates — which source is converting best this week? If email is converting at 4.2% and paid social at 0.9%, your paid social landing page or audience targeting needs attention.
This framework converts your Shopify Analytics dashboard from a number-watching exercise into a decision-producing system. The habit of reviewing the same metrics against the same questions each week builds pattern recognition over time that no one-off deep dive can replicate.
When to Go Beyond Shopify's Native Analytics
Shopify Analytics handles the 80% of operational reporting that drives day-to-day decisions. The situations that justify investing in third-party analytics tools are specific and recognizable.
When you need true multi-touch attribution — understanding how a customer who saw a TikTok ad, clicked a Google search result, and then converted from an email should have that revenue credited across all three touchpoints — you need Triple Whale or Northbeam. Shopify's last-non-direct-click model credits only the email in this scenario, which understates the contribution of the earlier touchpoints that built the purchase intent.
When you need customer lifetime value tied to acquisition source — understanding which ad campaign's customers are still purchasing 12 months later — you need Lifetimely or Polar Analytics. This is the metric that separates profitable growth from growth that looks good in the short term but is not building a durable business.
When you need contribution margin by channel — the actual profitability after COGS, ad spend, fulfillment, and returns are all accounted for — you need to blend Shopify data with your accounting system and ad platform data, either through a reporting tool or a spreadsheet model. Shopify cannot produce this natively because it does not have visibility into your ad spend or your true landed cost per unit.
When you need automated reporting that saves your team significant time — weekly revenue reports emailed to stakeholders, inventory alerts triggered by specific thresholds, cohort analysis updated automatically — Report Pundit or Glew.io extend Shopify's native reporting with automation and scheduling capabilities that the native platform does not offer.
For stores under $500,000 in annual revenue, Shopify's native analytics combined with Google Analytics 4 — connected through Shopify's native GA4 integration — covers the vast majority of decision-making needs. The investment in third-party analytics tools makes economic sense when the decisions those tools enable are large enough in dollar terms to justify the subscription cost.
Shopify Analytics by Plan: What You Actually Get
Report availability in Shopify is plan-dependent in ways that are worth understanding before drawing conclusions from what you can and cannot see in your dashboard.
The basic Shopify plan includes the analytics overview dashboard, finance reports, product analytics, and basic acquisition and behavior reports. It does not include custom report saving, advanced filtering, or ShopifyQL — Shopify's query language for building custom data explorations.
Shopify's standard plan adds most report categories including customer reports, marketing reports, and inventory reports with more filtering options. The significant limitation at this tier is that edited reports cannot be saved permanently — you can filter and customize a report view, but closing the tab loses those customizations.
Advanced Shopify and Shopify Plus unlock the full report builder, saved custom reports, ShopifyQL access, and the most granular filtering and segmentation capabilities. The custom report builder on these plans allows merchants to create precisely the data views their business needs rather than working within the constraints of preset report formats.
Shopify's Spring 2026 Edition added Insights, Annotations, and metric targets directly to the Analytics dashboard on all plans — a significant improvement that brings contextual interpretation of data changes into the native analytics experience rather than requiring merchants to figure out why numbers changed without any platform assistance.
From Data to Decisions: The Questions That Drive Revenue Growth
The shift from scoreboard watching to genuine analytics practice happens when you replace "what happened?" with "what should I do next?"
These are the questions that productive Shopify Analytics use answers:
Which of my products have the highest return rate, and what do they have in common? If three of your five highest-return products share a specific size variant or a specific photography angle, you have identified a systemic product page problem, not a random returns issue.
Which traffic source sends customers with the highest repeat purchase rate? If customers from organic search repurchase at twice the rate of customers from paid social, your SEO investment has a compounding return that your ROAS analysis is not capturing.
Does my average order value increase when I offer free shipping above a specific threshold? Set your free shipping threshold and run the comparison in your sales reports. If AOV is not moving above the threshold, the offer is not changing behavior and the margin cost is pure cost.
Which day of the week and time of day do my email subscribers convert at the highest rate? Your marketing reports combined with order time data will reveal the send windows that produce the best revenue per send — and that insight is immediately actionable in your Klaviyo flow and campaign scheduling.
What is my conversion rate on new versus returning visitor sessions? If returning visitors convert at 4x the rate of new visitors — which is typical — your highest-ROI marketing investment is the activities that bring existing customers back, not the activities that bring new customers in.
Each of these questions leads to a decision. Each decision, made with data rather than assumption, compounds over time into a measurably better-performing store.
Final Thoughts
Shopify Analytics is not a passive reporting tool. It is a decision-support system — and its value is entirely dependent on the quality of the questions you bring to it.
The merchants who grow consistently do not look at more data than their competitors. They look at the same data more systematically, ask better questions of it, and act on the answers with more discipline. The weekly review practice, the four core metrics tracked against a consistent framework, and the habit of asking "what decision does this inform?" rather than "what does this number mean?" — these are the practices that separate stores that grow from stores that generate activity.
Your data is already there. It is updated in real time. It is free to access regardless of your plan level. The only investment required to turn it into revenue growth is the habit of using it intentionally.
Need help building a custom analytics dashboard for your Shopify store, or want an expert to audit your current store data and identify your highest-priority growth opportunities? Get in touch with EcomFixify — we specialize in Shopify development and ecommerce growth strategy for data-driven brands.
More Topics You Need
How to Start a Shopify Store With Zero Budget in 2026 (Step-by-Step)
Shopify vs WooCommerce vs BigCommerce: Which Platform Wins in 2026?