
Shopify Analytics: Read Data and Grow Revenue in 2026
Most Shopify store owners check their analytics the same way. They open the dashboard, look at the revenue number for the day, feel good or bad about it, and close the tab. The data has been seen. Nothing has changed.
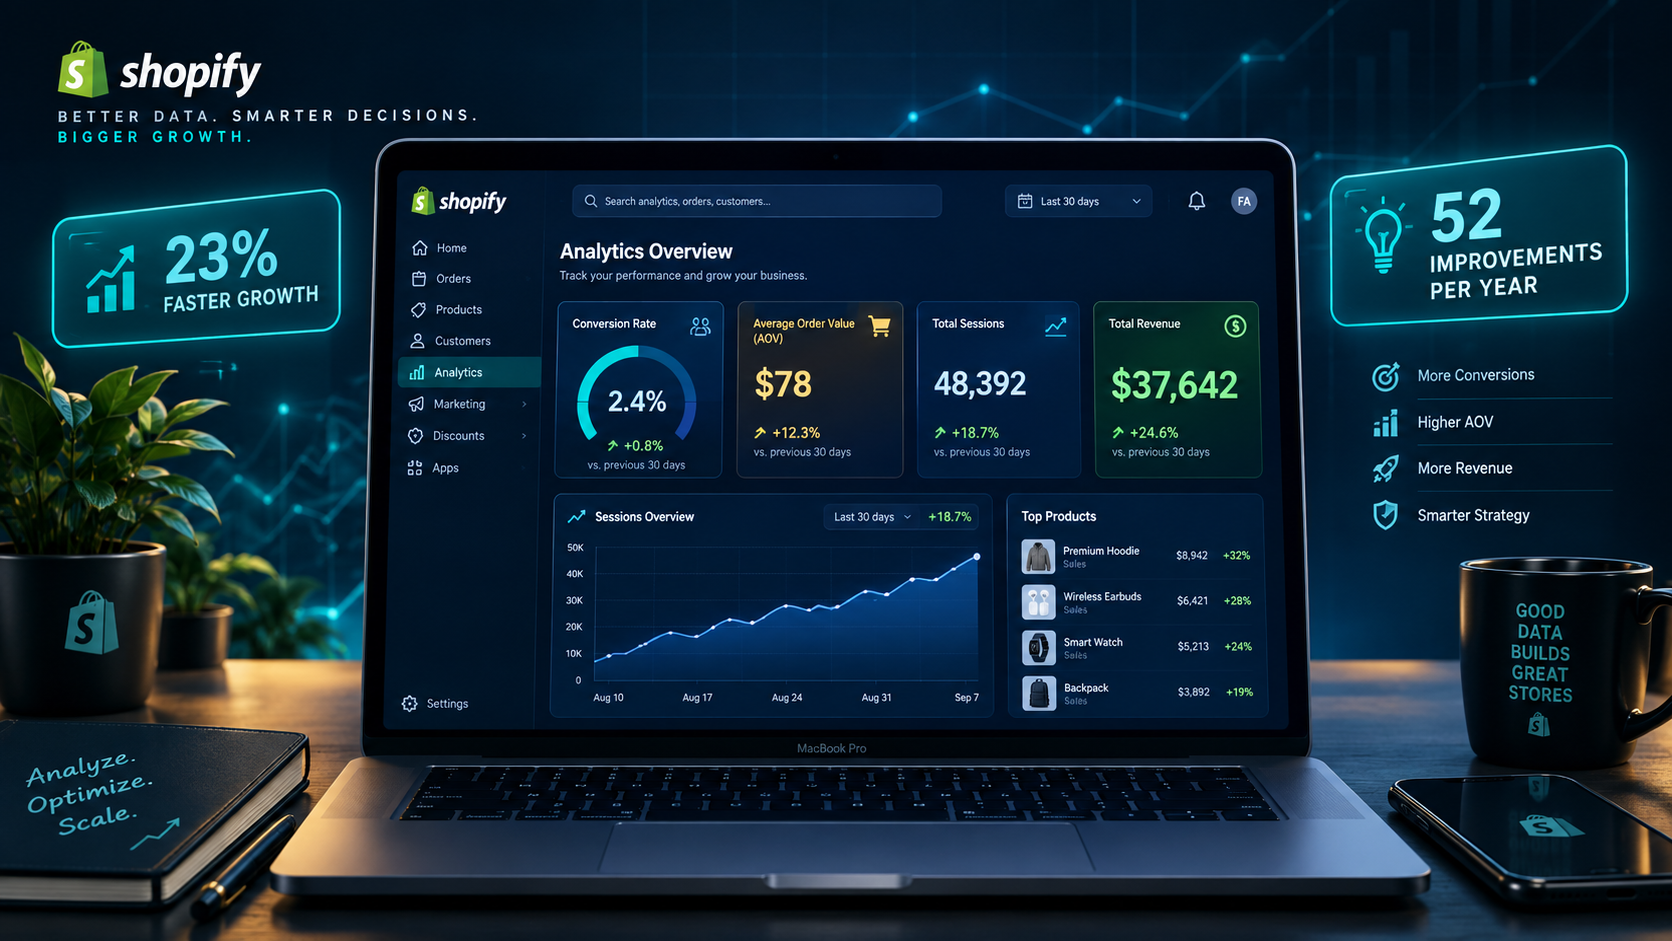
The gap between looking at data and acting on data is where most Shopify stores stagnate. Stores that actively use analytics — tracking metrics consistently and running decisions based on what the numbers say — grow 23% faster than stores that rely on intuition alone. That gap compounds over time into a structural performance advantage that intuition-driven competitors cannot close without changing how they work.
But the challenge is real. Shopify's analytics dashboard is extensive. The reports are numerous. The metrics are interconnected. And most guides to Shopify analytics list every available report without explaining which ones actually matter, what each number is telling you, and — most importantly — what to do when a number moves in the wrong direction.
This guide solves that problem. It covers the specific metrics worth tracking weekly, the reports that surface the most actionable insights, how to layer Google Analytics 4 on top of Shopify's native data, and the decision framework that turns data from a scoreboard into a growth engine.
What Shopify Analytics Can and Cannot Tell You
Before diving into specific reports, understanding the boundaries of Shopify's native analytics prevents the most common data misreading mistake — treating Shopify's numbers as the complete picture when they are one part of a larger truth.
Shopify's built-in analytics tracks what happens inside your store. It reports sales volume, traffic sources, product performance, customer behavior, and financial summaries accurately within its scope. The overview dashboard gives you a real-time pulse on revenue, orders, and visitors. The reports section provides deeper cuts by product, geography, traffic source, and customer type.
What Shopify's native analytics does not do well is tell you why things are happening, how your store compares to off-site behavior, or how different traffic channels interact across a customer's full purchase journey. It tells you what happened — not what to do next.
For conversion optimization, the most actionable data lives in funnel analysis — understanding where visitors drop off between landing on your store and completing a purchase. Shopify's native analytics shows you session and order numbers but does not clearly visualize the stages between them. That gap is where Google Analytics 4, combined with Shopify's native reports, delivers the complete picture needed to make genuinely informed growth decisions.
The 12 Metrics That Actually Matter for Shopify Growth
Most merchants track too many metrics or track the wrong ones. Vanity metrics — total sessions, page views, social followers — show volume but not performance. The metrics that drive decisions are the ones that change how much revenue your store generates per visitor, per customer, and per dollar of marketing spend.
These twelve deserve weekly attention. Understand them collectively rather than in isolation — each one tells part of a story, and the most important insights emerge from how they relate to each other.
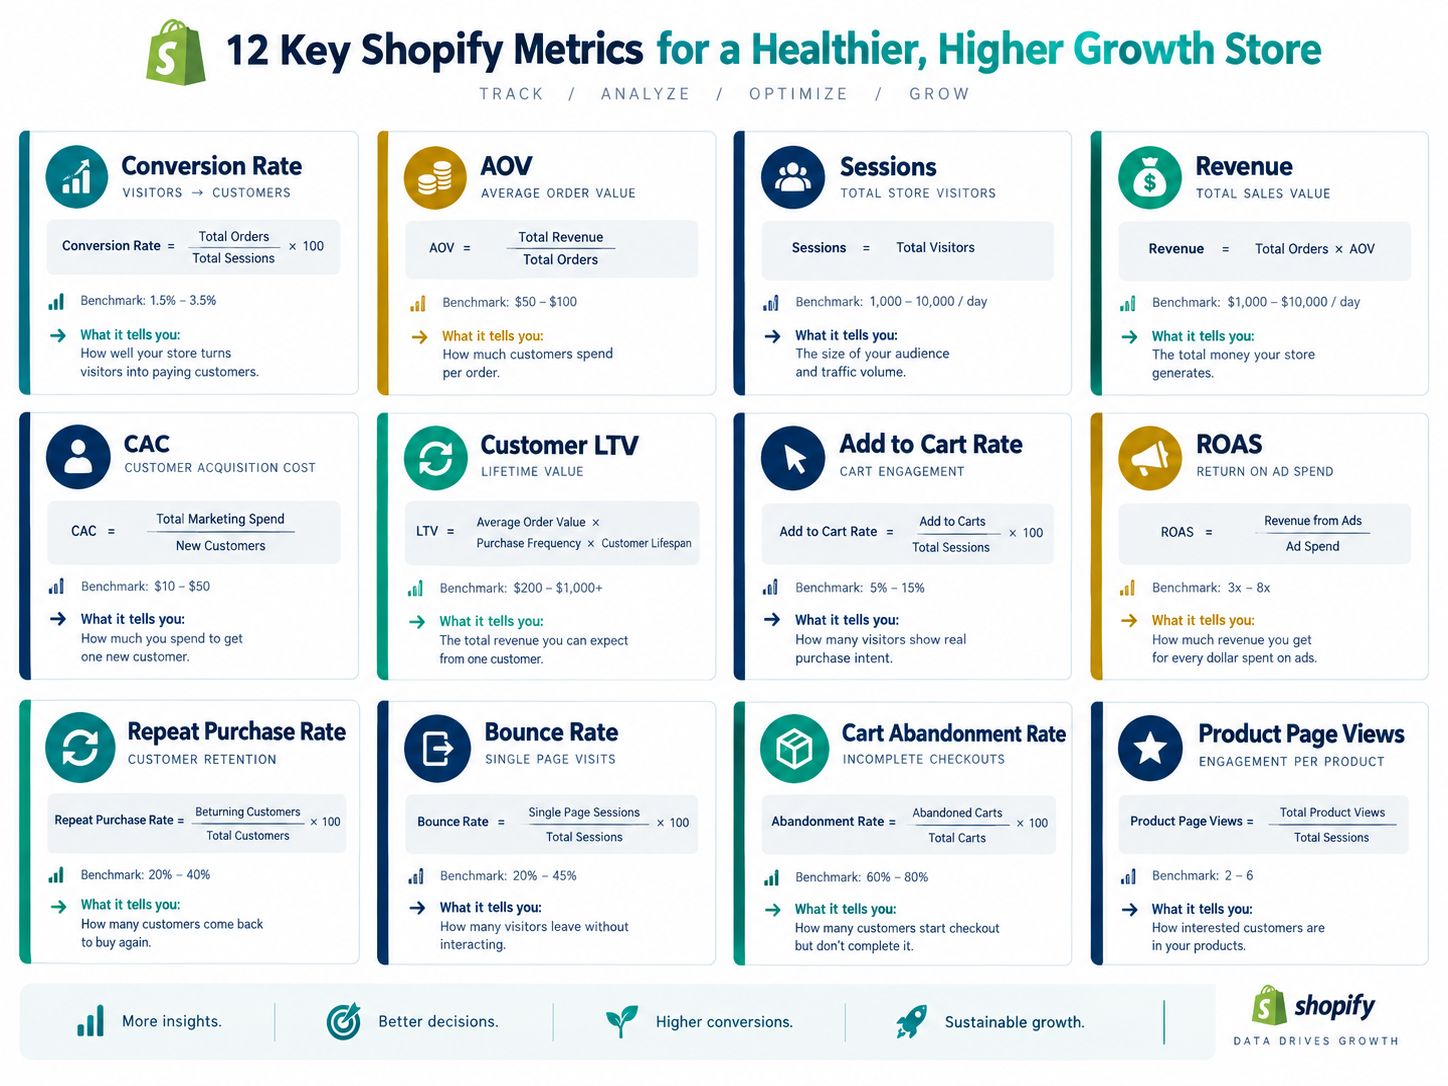
Conversion Rate is the percentage of sessions that result in a completed purchase. It is calculated as orders divided by sessions multiplied by 100. The Shopify benchmark for established stores in 2026 is 1.5 to 2.5% overall, with top-performing stores exceeding 3.5% on specific product pages. Your overall conversion rate is the most direct measure of how effectively your store turns traffic into revenue — and a 1% improvement on 10,000 monthly sessions at $60 AOV means $6,000 in additional monthly revenue from zero additional traffic.
Average Order Value is total revenue divided by number of orders. The Shopify benchmark varies significantly by category — $50 to $120 is the broad ecommerce range — but the direction of movement matters more than the absolute number. Rising AOV indicates that bundle pricing, upsells, or cross-sells are working. Declining AOV while volume holds suggests customers are buying fewer items per transaction or gravitating toward lower-priced SKUs.
Customer Lifetime Value is the total revenue a customer generates across all their purchases with your brand. A minimum healthy LTV is three times your average order value — meaning customers should buy at least three times on average. LTV is the metric that determines how much you can afford to spend acquiring a customer and still be profitable, which makes it the foundational metric for scaling paid advertising sustainably.
Customer Acquisition Cost is total marketing spend divided by the number of new customers acquired in the same period. When CAC exceeds 30% of AOV, paid acquisition is typically margin-negative on the first purchase and depends entirely on repeat purchases to become profitable. When CAC is below 20% of AOV, you have significant room to scale acquisition spend while maintaining profitability.
Return on Ad Spend measures revenue attributed to advertising divided by advertising spend. The Shopify benchmark for paid social is 2 to 4 times, with well-optimized campaigns regularly achieving 3.5 to 5 times. Platform-reported ROAS overstates actual performance by 15 to 40% due to iOS attribution gaps — which is why Marketing Efficiency Ratio (total revenue divided by total marketing spend) is used alongside platform ROAS rather than instead of it.
Repeat Purchase Rate is the percentage of customers who make a second purchase within a defined window — typically 12 months. Industry benchmarks suggest 27 to 32% of customers make a second purchase within their first year. Below 20% indicates that your post-purchase retention system needs attention. Above 40% indicates strong product-market fit and retention mechanics that should be studied and reinforced.
Cart Abandonment Rate is the percentage of sessions that add to cart but do not complete a purchase. The Shopify average is 70 to 72%. Above 80% typically indicates a checkout problem — friction, unexpected costs, or missing payment methods. Below 60% indicates an exceptionally well-optimized checkout or a product type with unusually high purchase intent.
Bounce Rate is the percentage of sessions where visitors view only one page before leaving. The benchmark for Shopify stores is 40 to 60%, with landing pages from paid advertising typically running higher. A bounce rate significantly above 60% on organic traffic or direct traffic suggests either a targeting mismatch or a page speed or first-impression problem that needs addressing.
New vs Returning Customer Ratio tells you the balance between acquisition and retention driving your revenue. A ratio heavily skewed toward new customers — above 80% new — indicates weak retention and high dependency on continuous acquisition spend. A ratio trending toward returning customers — 40% or more returning — indicates strong product satisfaction and retention mechanics that are compounding the value of past acquisition investment.
Add to Cart Rate is the percentage of product page sessions that result in an add-to-cart event. A healthy add-to-cart rate is 8 to 12% for most Shopify categories. Significantly below this threshold suggests product page problems rather than traffic quality issues.
Sessions by Traffic Source breaks down your visitors by how they arrived — organic search, paid search, paid social, email, direct, referral, and social organic. This report is the starting point for understanding which channels are delivering traffic efficiently and which are underperforming relative to their cost.
Revenue by Product identifies which SKUs are driving the most revenue and which are underperforming relative to their position in your catalog. Products generating disproportionately high revenue relative to their page views deserve investment in inventory, marketing, and content. Products with high page views but low conversion rates are product page problems waiting to be solved.
The Reports That Drive the Most Actionable Decisions
Knowing which metrics to track is step one. Knowing which specific Shopify reports surface those metrics most efficiently is step two.
The Sales Over Time report, found under Analytics → Reports → Sales, shows your revenue trend over any time period you define. The pattern of this graph is more important than any individual day's number. A consistent upward slope indicates healthy growth. A flat line with high peaks and deep troughs indicates seasonal or campaign dependency without a stable baseline. A downward slope over 60 or more days is a signal that requires immediate investigation.
The Sessions Over Time report paired with Sales Over Time creates the most important comparison in your analytics. If sessions are growing but sales are not growing proportionally, your conversion rate is declining. If sales are growing faster than sessions, your conversion rate or AOV is improving.
The Top Products by Units Sold report reveals what your customers actually want as opposed to what you expect them to want. Many Shopify merchants are surprised by the gap between their bestselling products and the products they invest most in marketing. This report should directly inform which products get the most prominent placement on your homepage, collection pages, and in your email flows.
The Customer Reports section — specifically Customers Over Time and Returning Customer Rate — shows the health of your retention system over time. A growing total customer count with a declining returning customer rate is a leaking bucket — you are acquiring customers but failing to retain them.
The Sessions by Device report reveals the mobile-desktop split for your specific store and identifies whether your mobile conversion rate is meaningfully different from your desktop rate. If your store's mobile-desktop gap is wider than the industry benchmark, mobile optimization is your highest-priority conversion opportunity.
The Traffic by Source report shows which acquisition channels are delivering sessions. High-volume low-conversion sources are delivering the wrong audience. Low-volume high-conversion sources are underinvested channels that deserve more resource allocation.
Setting Up Google Analytics 4 Alongside Shopify Analytics
Shopify's native analytics is designed for store management. Google Analytics 4 is designed for behavioral analysis. The two tools answer different questions, and using both together gives you a more complete picture than either provides alone.
GA4 tracks the complete customer journey from first visit through conversion, across sessions and devices, with full funnel visualization that Shopify's native reports do not provide. It shows you exactly where in the purchase funnel visitors drop off — on product pages, at the add-to-cart stage, during checkout initiation, or at the payment step.
Setting up GA4 for Shopify in 2026 requires installing the GA4 tag through Google Tag Manager or through Shopify's native Google channel integration. The most important events to ensure are firing correctly are page_view for all pages, view_item for product page loads, add_to_cart for cart additions, begin_checkout for checkout initiations, add_payment_info for the payment step, and purchase for completed orders.
A funnel that shows 100% of sessions entering, 25% reaching product pages, 8% adding to cart, 4% initiating checkout, and 2% completing purchase tells you the primary drop-off is between add-to-cart and checkout initiation — a checkout friction problem rather than a traffic quality or product page problem. Each of those three diagnoses requires a different intervention, and the funnel data tells you which one to prioritize.
The Weekly Analytics Routine That Drives Consistent Growth
Analytics generates value only when it generates decisions. A weekly review discipline — not daily, which leads to overreaction to noise, and not monthly, which responds too slowly to meaningful trends — creates the consistent improvement cadence that compounds into sustained revenue growth.
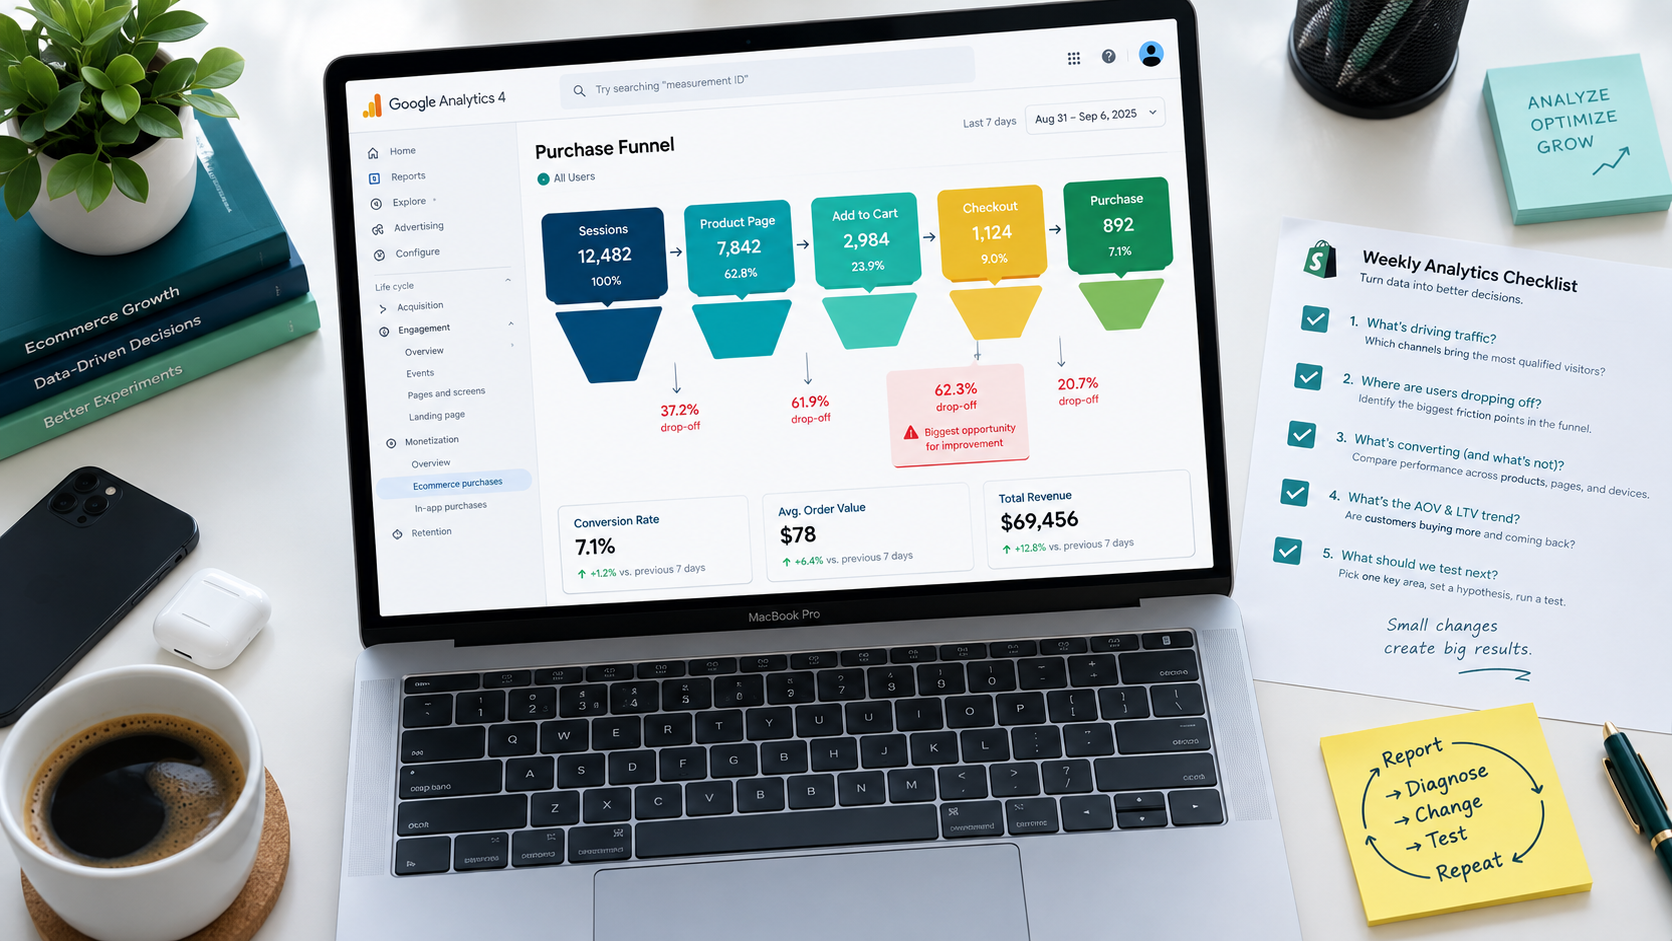
A useful weekly analytics routine takes 30 to 45 minutes and covers five questions:
What is my conversion rate this week compared to last week and the same week last month? A conversion rate decline of more than 10% week-over-week warrants investigation — check for traffic source shifts, device mix changes, or product page issues.
Which products had the highest add-to-cart rate but lowest purchase conversion rate this week? These products have demand but are failing to close. The gap between add-to-cart and purchase usually indicates checkout friction, pricing concerns, or missing trust signals specific to that product.
What is my traffic source mix this week, and has anything shifted significantly? A sudden increase in direct traffic often reflects an offline mention or a viral moment. A sudden increase in paid traffic with flat revenue suggests a campaign is delivering volume without conversion.
What is my new versus returning customer ratio this week? If the returning customer percentage is declining, your retention system needs attention. If the new customer percentage is declining while overall traffic holds steady, your acquisition channels are becoming less efficient.
Which products had the highest return rate or the most customer service contacts this week? Return data and support data are the most direct signals that a product is not meeting customer expectations. Acting on this data within the same week it appears prevents a manageable product issue from becoming a catalog-wide reputation problem.
Beyond Shopify: The Analytics Stack Worth Building
Shopify Analytics and Google Analytics 4 together cover the majority of insight needs for stores up to approximately $500,000 in annual revenue. Above that threshold, additional analytics tools deliver meaningful ROI through more sophisticated attribution, cohort analysis, and revenue forecasting.
Triple Whale and Northbeam are the two leading multi-touch attribution platforms built specifically for Shopify in 2026. Both replace platform-reported ROAS with a unified revenue picture that attributes sales across touchpoints based on observed customer behavior rather than last-click assumptions. At advertising spend levels above $10,000 per month, the budget decisions enabled by accurate multi-touch attribution typically pay for the tool cost many times over.
Klaviyo's analytics provides the most granular visibility into email and SMS channel performance and customer segment revenue. The Predictive Analytics feature projects each customer's expected next purchase date and lifetime value, enabling proactive outreach to customers approaching a purchase moment.
Lifetimely and TrueProfit are profit analytics tools that address the most significant gap in Shopify's native reporting — the absence of true profit visibility. Shopify reports gross revenue but does not deduct COGS, shipping costs, payment processing fees, or advertising spend to show actual profit. Both tools connect to your supplier cost data and advertising platforms to show real profit per order, per product, and per customer.
How to Use Your Data to Make Specific Decisions
Data without a decision framework is noise. These decision triggers translate the metrics covered in this guide into specific actions.
When conversion rate declines more than 10% week-over-week: check your traffic source mix first. If the mix is stable, check your top product pages for speed regressions, broken images, or out-of-stock variants.
When add-to-cart rate is below 5% on a high-traffic product page: the problem is on the product page, not in the checkout. Investigate hero image quality, description clarity, social proof volume, and whether the add-to-cart button is visible without scrolling on mobile.
When cart abandonment rate exceeds 80%: the problem is in the checkout. Investigate shipping cost visibility, express checkout availability, form field count, and trust signal placement.
When returning customer rate falls below 20% over a 60-day period: your post-purchase retention system needs attention. Activate or audit your post-purchase email flow, check your review request sequence, and evaluate whether your loyalty program is visible enough to drive re-engagement.
When a traffic source delivers above-average sessions but below-average conversion rate: test audience-specific landing pages before concluding the channel itself is ineffective.
When Revenue by Product shows a top-five SKU with declining units over a 30-day period: investigate whether the decline is seasonal, competitive, or driven by an emerging product page problem.
The Data-Driven Decision Cycle
The most useful frame for Shopify analytics is a continuous improvement cycle rather than a periodic audit. The cycle has five stages that repeat weekly and compound in improvement over time.
Report — pull the five weekly metrics from your Shopify admin and GA4. Diagnose — identify which metric has moved most significantly and in which direction. Change — implement the specific intervention that the data indicates. Test — allow sufficient time for the change to produce measurable results before evaluating — typically two to four weeks. Repeat — run the next cycle based on what the most recent data shows.
One cycle per week yields 52 improvements per year. Most of those improvements will be small — a 0.1% conversion rate lift here, a 2% AOV improvement there. But applied consistently to the same traffic base, those small improvements compound into performance differences that separate the stores growing 30% year-over-year from the ones growing 5%.
The merchants who use their data well are not doing anything technically sophisticated. They are reviewing the same reports every week, asking the same diagnostic questions, making specific changes based on what they find, and measuring whether those changes worked. That discipline — unremarkable in any individual week — is what produces remarkable growth over the span of a year.
Need help setting up your Shopify analytics correctly, connecting GA4 to your store, or building the reporting framework that drives consistent growth decisions? Get in touch with EcomFixify — we specialize in Shopify development and ecommerce growth strategy for brands ready to make data work for them.