
How to Reduce Shopify Return Rates: 12 Proven Strategies for 2026
Returns are the silent profit destroyer in every Shopify store. They are expensive, operationally complex, and — critically — largely preventable. Yet most merchants treat returns as an inevitable cost of doing business rather than a systematic problem with systematic solutions for How to Reduce Shopify Return Rates: 12 Proven Strategies
US retail returns reached $890 billion in 2025. The average ecommerce return rate sits at 20 to 30% across categories — more than double the 8.7% return rate for physical retail. In apparel it reaches 40%. Every returned product costs the merchant shipping in both directions, staff time for processing, potential product damage, and the loss of a satisfied customer who now associates your brand with disappointment.
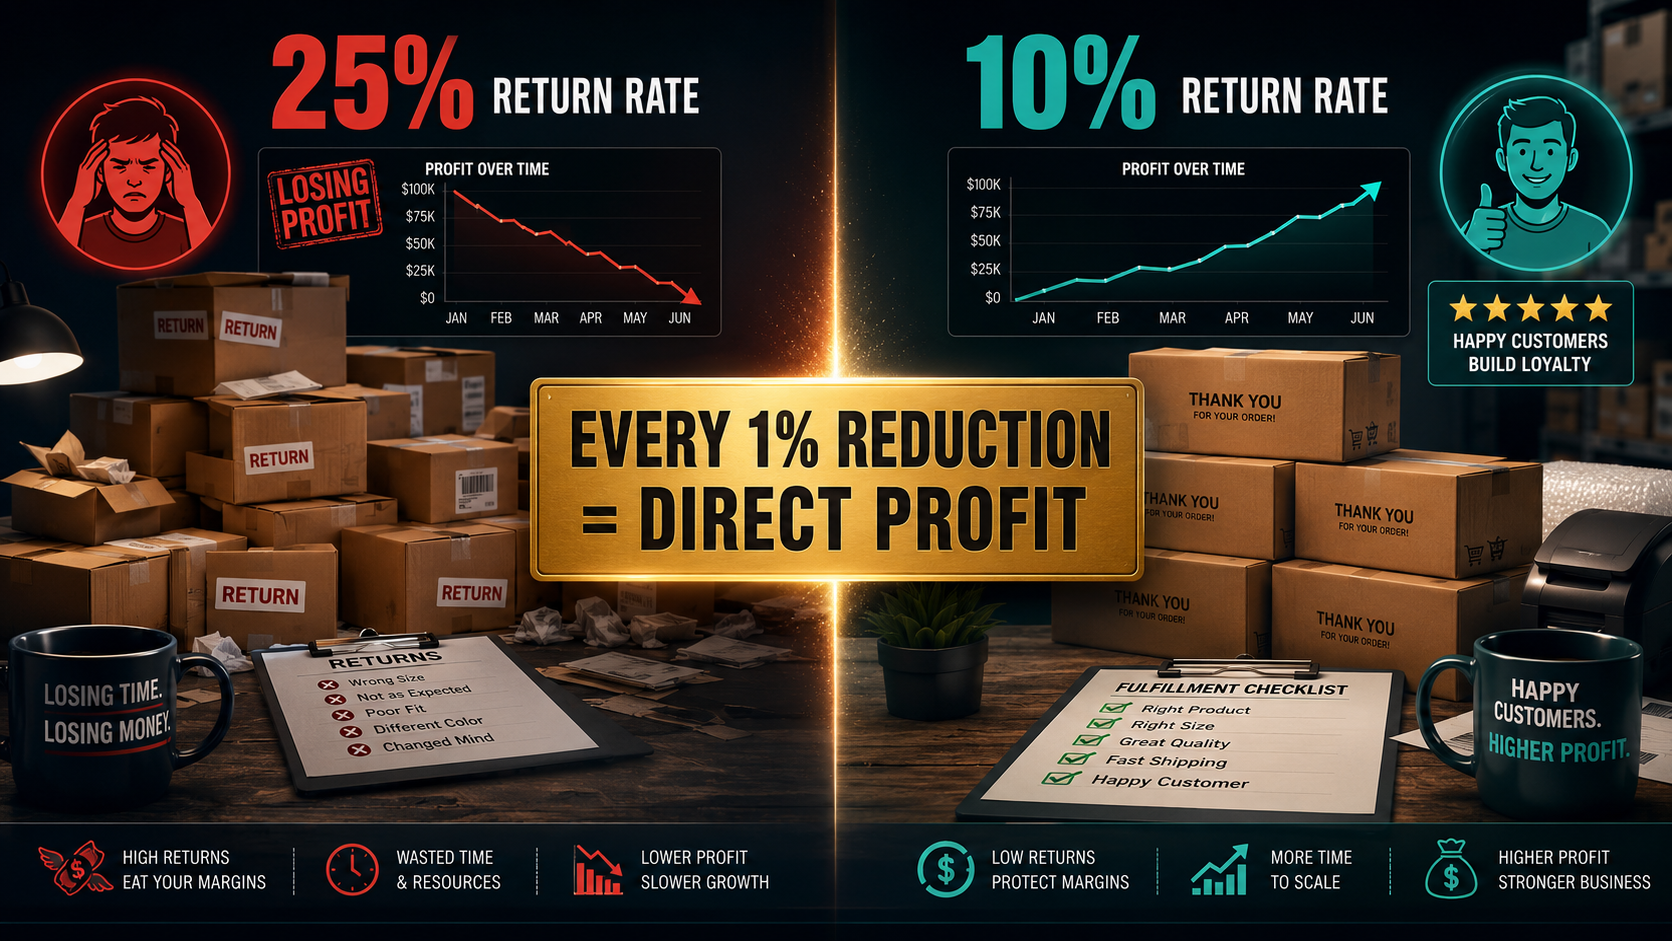
The math on reducing your return rate is direct and significant. A Shopify store doing $50,000 per month with a 25% return rate and $20 average processing cost per return is spending $2,500 per month on returns alone — $30,000 annually. Reducing that rate by five percentage points saves $6,000 per year from zero additional revenue. Every percentage point reduction flows directly to your bottom line permanently.
Here is what makes the return rate problem genuinely solvable: 45% of all ecommerce returns trace back to expectation gaps — size, fit, color, or product description mismatches. These are not returns caused by bad products. They are returns caused by bad information provided at the purchase stage. Fix the information problem and you fix nearly half of your returns automatically.
This guide covers the 12 strategies that measurably reduce Shopify return rates in 2026, organized from the highest-impact changes to the operational refinements that complete the system.
Understanding Your Return Rate Before You Optimize It
Before applying any strategy, knowing your baseline numbers is essential. You cannot improve what you have not measured.
Your return rate is calculated as total returns divided by total orders, expressed as a percentage. If you processed 1,000 orders last month and received 180 returns, your return rate is 18%. Track this monthly and by product category — because your overall return rate masks significant variation between products that will point you toward exactly which pages and products need the most attention.
Category benchmarks for 2026: apparel and footwear run 25 to 40% return rates; electronics and home goods average 15 to 20%; beauty and cosmetics sit at 5 to 10%; general consumer goods average 18 to 25%. If your return rate exceeds your category average by more than five percentage points, there are specific, fixable issues driving it.
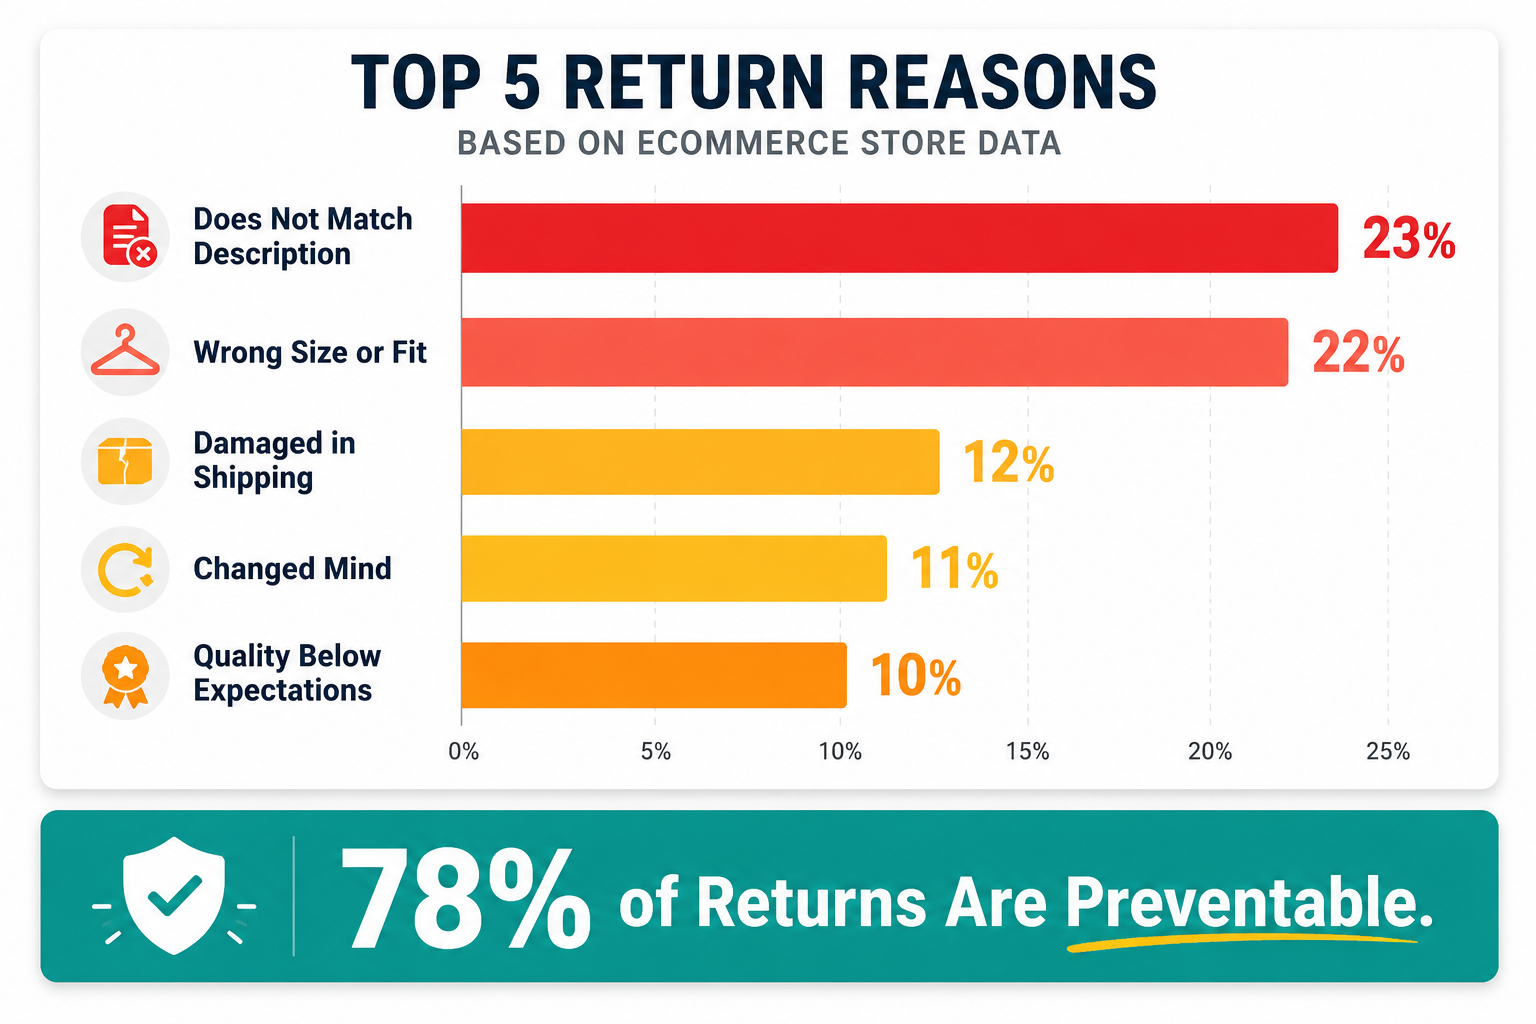
The top reasons customers return ecommerce purchases in 2026 are product does not match description or photos at 23%, wrong size or fit at 22%, damaged in shipping at 12%, changed mind at 11%, quality below expectations at 10%, wrong item received at 8%, and found a better price elsewhere at 7%. Notice that the top five reasons — totaling 78% of all returns — are every one of them preventable on your end with the right practices.
Strategy 1: Fix Your Product Photography First
The single most direct line between a product return and its cause is almost always a photography problem. A customer who receives a product and says "it did not look like the photos" is telling you exactly what failed.
High-quality photography from multiple angles, with scale references and lifestyle context, is not a nice-to-have — it is your most important return-prevention investment. The minimum standard for product images in 2026 is six to eight photos per product: a clean hero shot on white background, front and back views, close-ups of material texture and key features, a scale reference showing the product in context of something familiar, and at least one lifestyle shot showing the product in real use.
For products where color accuracy matters — apparel, home décor, cosmetics — shoot under consistent, accurate lighting and explicitly state in both the product description and a photo caption whether colors appear slightly different on different screens. This one sentence prevents a meaningful percentage of color-mismatch returns by setting honest expectations before purchase.
For products where size is the primary concern — furniture, rugs, lighting fixtures, bags — include a photo of the product next to a common size reference: a standard door, a person of average height, or a recognizable household object. Customers who can viscerally understand a product's dimensions from a photo make better size decisions and return less frequently.
Strategy 2: Write Product Descriptions That Tell the Truth
Product descriptions written to maximize desire rather than accuracy are a return-rate timebomb. A description that overpromises what a product delivers creates customers who are primed for disappointment — and disappointment generates returns.
The product descriptions that reduce returns are accurate, specific, and honest about limitations. If a fabric has a specific texture that photographs differently than it feels, say so. If a color looks slightly different under warm lighting than in product photos, note it. If a product runs large or small, state it explicitly rather than leaving customers to guess.
The two-layer description structure that serves both conversion and return prevention: open with the emotional benefit the product genuinely delivers, then provide complete technical specifications in bullet points covering dimensions, materials, weight, compatibility, care instructions, and any limitations that a buyer should know before purchasing.
This honesty-first approach does not reduce conversion rates — it improves them, because customers who buy with accurate expectations are satisfied customers who review positively, return less frequently, and repurchase at higher rates.
Strategy 3: Add Comprehensive Size Guides Adjacent to Variant Selectors
22% of all ecommerce returns are caused by wrong size selection. For apparel and footwear specifically, sizing-related returns can account for over half of total returns — making size guidance the highest-leverage single return-reduction investment for fashion Shopify stores.
The critical detail most merchants miss: your size guide must be adjacent to the size selector, not buried at the bottom of the page or accessible only through a separate tab. A customer who cannot find size guidance without significant effort will guess — and when they guess wrong, they return.
An effective size guide for apparel shows body measurements — chest, waist, hips, inseam — not just garment dimensions. Garment dimensions tell customers what the product measures. Body measurements tell them whether the product will fit their body. These are different things, and the distinction accounts for a significant portion of sizing-related returns.
Supplement your size guide with customer fit feedback directly in your review section. When reviews consistently note "runs small" or "runs large," surface that information prominently near the size selector with a "Customers say: this item runs small — we recommend sizing up" note. This real-world fit feedback from verified purchasers is more trusted than any official size guide and directly reduces size-related returns for products where sizing is inconsistent.
Strategy 4: Deploy 3D Models and Augmented Reality
For product categories where fit, scale, or visual accuracy in context are the primary return drivers, augmented reality is the most powerful return-reduction tool available on Shopify in 2026.
Products with 3D content and AR visualization reduce returns by up to 40% according to Shopify's own data, while simultaneously increasing conversion rates by up to 94%. The reason is straightforward: AR eliminates the imagination gap between what a customer sees on a product page and what they will experience in physical reality. A customer who has placed a virtual sofa in their actual living room and confirmed the scale, color, and proportion is not going to return it because "it was bigger than I thought."
Shopify supports 3D models natively in GLB and USDZ formats, enabling the "View in Your Space" AR button on compatible devices without any additional app. The cost of 3D model creation has dropped dramatically — models now range from $50 to $200 each using modern photogrammetry tools — making AR accessible for most Shopify stores on products where scale and context matter most.
Prioritize AR implementation for your highest-return SKUs first. If furniture, home décor, or lighting are generating disproportionate returns, AR on those specific products will deliver the fastest payback period on model creation costs.
Strategy 5: Improve Pre-Purchase Customer Communication
Many returns are caused not by bad products but by customers who did not fully understand what they were buying. Proactive pre-purchase communication bridges the gap between what a product page shows and what a customer expects to receive.
A pre-purchase FAQ section on each product page that addresses the most common questions and concerns about that product eliminates the information gaps that lead to post-purchase disappointment. Review your return data and return reason codes to identify the most common reasons customers return each product — then address each one directly in the FAQ section.
Live chat or AI-assisted chat on product pages allows customers to ask specific questions before purchasing — particularly valuable for high-ticket items and products with complex sizing or compatibility requirements. A customer who asks "will this work with my specific setup" and gets an accurate answer before buying will not return the product when the answer turns out to be no.
Post-purchase communication matters equally. An email sent one to three days after shipping — before the product arrives — that prepares the customer for what they are about to receive, sets expectations about assembly or first-use, and provides care or usage instructions reduces the rate of "quality below expectations" returns significantly. The customer who is surprised by an assembly requirement returns the product. The customer who was told about it beforehand accepts it as expected.
Strategy 6: Tighten Your Quality Control Process
12% of all returns are caused by damaged or defective products. These are entirely preventable through systematic quality control before fulfillment — and they are the most expensive type of return because they also generate negative reviews, customer service costs, and potential replacement shipping.
For Shopify merchants using suppliers or manufacturers, establish written quality specifications for every product and require photographic documentation of random inspection batches from each production run. For merchants fulfilling from their own inventory, implement a pick-and-pack checklist that includes a visual inspection of each item before packaging.
Packaging quality directly affects the damaged-in-shipping return category. Products that arrive damaged because of inadequate packaging are returns that your supplier and your packaging choices created — not the product itself and not the customer. Right-size your packaging to minimize movement in transit, use appropriate void fill for fragile items, and mark fragile products on the exterior of the package so carrier handling reflects the content.
The operational investment in better quality control and packaging pays back through lower return rates, fewer replacement shipments, fewer negative reviews, and higher customer satisfaction scores — all of which compound in value over time.
Strategy 7: Use Returns Data as a Product Intelligence Tool
Your return data is the most underutilized product intelligence source in your Shopify store. Most merchants look at their return rate as a single aggregate number. The most effective merchants analyze returns at the SKU level to identify which specific products are driving disproportionate return volume — and why.
In Shopify, export your returns data and sort by product. Identify the top 20% of SKUs by return volume and examine the return reason codes for each. The patterns that emerge will tell you exactly what needs to change: is a specific product generating consistent "not as described" returns suggesting a photography or description problem? Is a specific size in an apparel product generating consistent "wrong size" returns suggesting a sizing inconsistency from the manufacturer? Is a specific color generating consistent "color looks different" returns suggesting a photography accuracy problem for that colorway?
Each of these patterns points to a specific, solvable problem. Fix the product page for your ten highest-return SKUs and measure the return rate change over the following 60 days. Most stores see 3 to 7 percentage points of return rate reduction within two quarters when this approach is applied systematically to the top return-offending products.
Strategy 8: Offer Virtual Try-On for Applicable Categories
For beauty, eyewear, apparel, and jewelry — categories where the primary return driver is uncertainty about how the product will look on the specific customer — virtual try-on technology addresses the root cause directly.
Virtual try-on apps including Orme, ModiFace (for beauty), and Zakeke (for apparel and accessories) integrate with Shopify and allow customers to see products overlaid on their own camera view before purchasing. Brands using virtual try-on consistently report 20 to 35% reduction in returns for products where it is available, because customers who have tried a product virtually and confirmed it works for them are buying with confidence rather than uncertainty.
The technology has become significantly more accessible and affordable in 2026. For beauty and cosmetics brands especially — where foundation shade matching and lipstick color accuracy drive significant return volume — a virtual try-on integration is one of the highest-ROI single investments available for return rate reduction.
Strategy 9: Set Realistic Delivery Expectations
12% of returns are caused by customers who receive products after they needed them — and return them not because the product is wrong but because the timing was. A birthday gift that arrives after the birthday. A seasonal item that arrives when the season has passed. A product needed for an event that happened before delivery.
Display accurate shipping timelines on every product page — not just on the checkout page — so customers can make informed decisions about whether the product will arrive when they need it. If your standard shipping takes seven to ten business days, a customer who orders on a Thursday expecting a product by the following weekend will be disappointed and likely to return.
Adding a delivery date estimator to your product pages — "Order by December 18 for delivery before Christmas" — reduces expectation mismatches about timing and prevents the category of returns caused by late arrival. Several Shopify apps including Estimated Delivery Date and Delivery Timer handle this automatically based on your actual carrier data.
Strategy 10: Convert Returns Into Exchanges
Not every return is a permanently lost sale. Converting a return into an exchange retains 30 to 40% of revenue that would otherwise be refunded — and keeps the customer relationship intact rather than ending it with a refund.
The key to successful exchange conversion is making the exchange option more attractive than the return option at every stage of the return process. Loop Returns — the leading return management app for Shopify in 2026 — shows customers the exchange option before the refund option by default, with an instant credit that can be spent immediately rather than waiting for a refund to process. This default framing consistently converts 30 to 40% of would-be returners into exchangers.
For apparel stores where size exchanges are the most common request, enable "instant exchange" — shipping the replacement size before the original is returned. The operational risk is minimal for high-value customers with clean return histories, and the experience is so dramatically better than waiting for a refund that customers who receive instant exchanges report significantly higher satisfaction and repeat purchase rates.
Strategy 11: Implement Post-Purchase Onboarding for Complex Products
For products with any complexity in first use — skincare routines, technology products, fitness equipment, nutritional supplements — a structured post-purchase onboarding sequence dramatically reduces returns caused by incorrect use or unmet expectations about how long results take.
A customer who receives a skincare product expecting visible results in three days and sees none will return it as "ineffective." A customer who received an email on day two explaining that their specific product type takes four to six weeks to show results, with guidance on correct application, will stay the course and not return.
Design a three to five email post-purchase sequence for any product with a learning curve or delayed-effect result. Send it beginning one day after delivery. Include usage instructions, common first-use questions, realistic timeline expectations, and how to get support if needed. This onboarding sequence addresses the information gaps that cause "quality below expectations" returns — which at 10% of all returns represents a meaningful and completely preventable category.
Strategy 12: Analyze and Target Your Serial Returners
A disproportionate share of your total returns comes from a small percentage of customers who return habitually — buying multiple items with the intention of keeping one and returning the rest, or purchasing to use and return. Industry data suggests that 5 to 10% of ecommerce customers account for 30 to 40% of return volume.
Use Shopify's customer data to identify customers with return rates significantly above your store average. For these customers, consider flagging orders for manual review before fulfillment, adding a return restocking fee for customers above a defined return threshold, or — for extreme cases — politely declining future orders from confirmed serial returners.
Most importantly, analyze whether your serial returners are concentrated in specific product categories, which suggests a product or presentation problem rather than a customer behavior problem. A product that is consistently returned by a high percentage of its buyers is a product with an unresolved expectation gap — not a customer behavior issue.
The Return Rate Reduction Roadmap: Where to Start
Implement these 12 strategies in order of potential impact and implementation speed:
Week one and two — fix product photography to include six or more images per high-return SKU, add size guides adjacent to variant selectors, and audit your top ten return-offending products against the return reason data.
Week three and four — rewrite product descriptions for your highest-return products using the accuracy-first two-layer format, add FAQ sections addressing the most common return reasons, and implement pre-purchase chat.
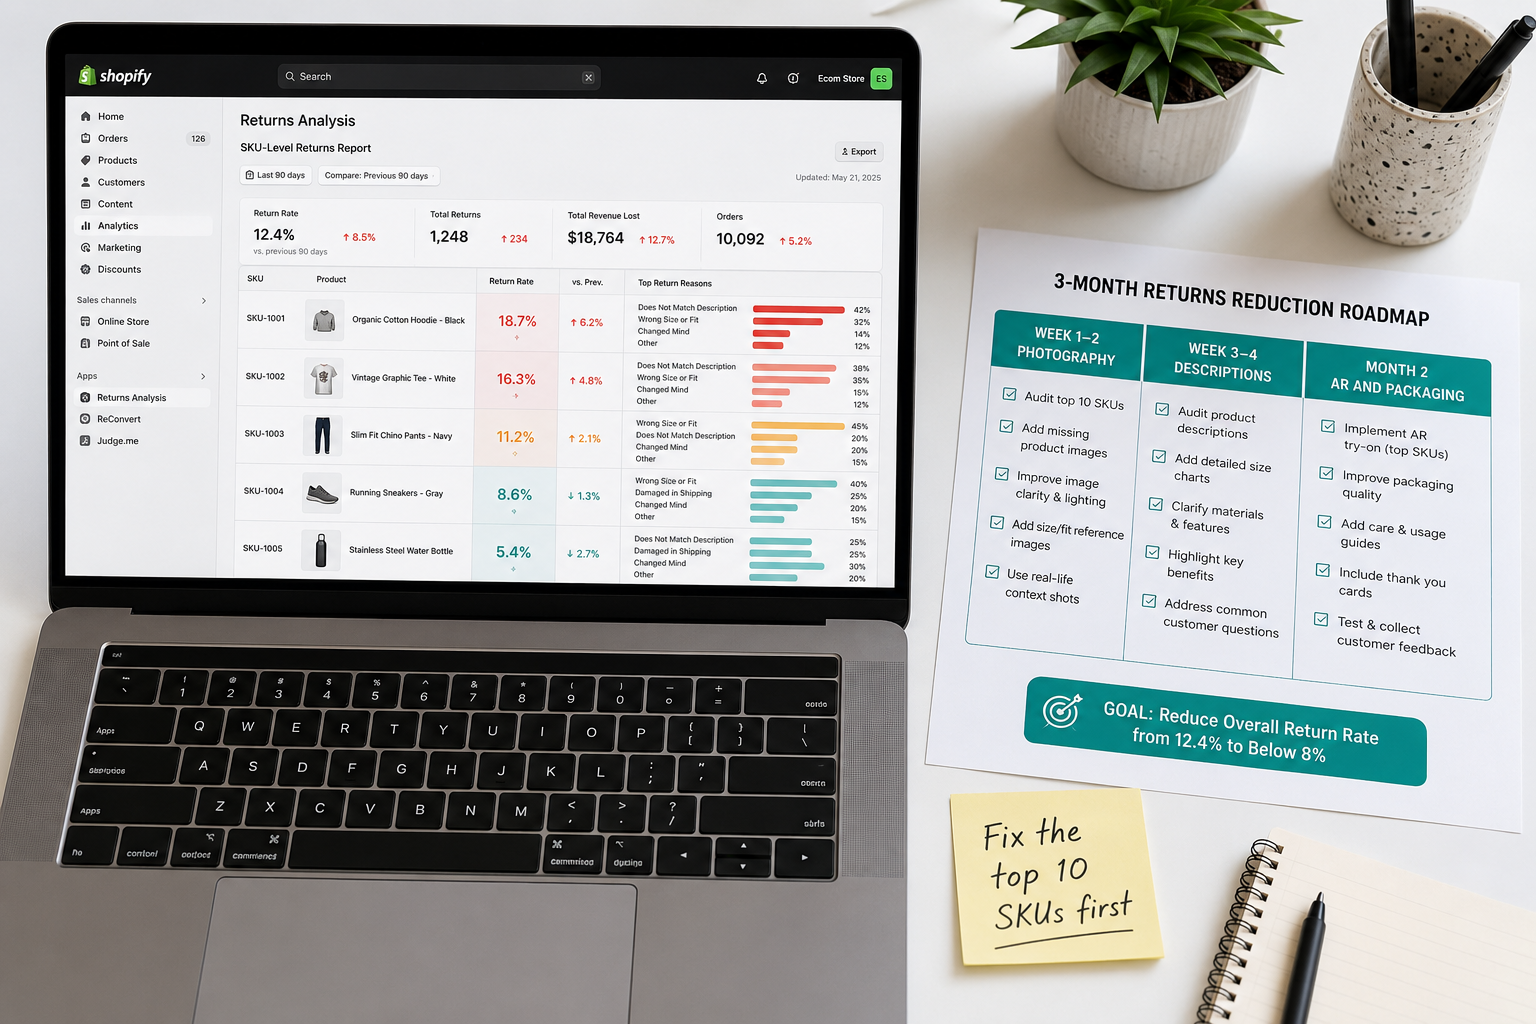
Month two — deploy 3D models or AR for your highest-return category, improve packaging for products returning damaged, and launch a post-purchase onboarding email sequence for complex products.
Month three onward — analyze serial returner data, implement Loop Returns for exchange conversion, and continue the SKU-level return audit quarterly.
Most stores that implement this roadmap systematically see 15 to 30% reduction in total return rates within two quarters. That reduction flows entirely to profit — the most direct revenue improvement available without acquiring a single additional customer.
Final Thoughts
Returns are expensive, operationally complex, and profoundly damaging to customer relationships — but they are not inevitable at the rates most Shopify stores accept. The 45% of returns caused by expectation gaps are preventable with better photography, more accurate descriptions, honest sizing guidance, and improved pre-purchase communication. The 12% caused by shipping damage are preventable with better quality control and packaging. The 10% caused by unmet expectations about product performance are preventable with better post-purchase communication.
The merchants with the lowest return rates in 2026 did not achieve them by tightening their return policies and hoping customers would accept fewer returns. They achieved them by making it easier for customers to buy correctly the first time — and by treating every return as a data point pointing to a specific, solvable problem.
Every percentage point of return rate reduction you achieve is a permanent improvement to your margin that requires no additional revenue to maintain. Start with your highest-return products, fix the most common return reasons first, and measure the results monthly. The compounding impact of systematic return reduction is one of the most underappreciated profit levers available to any Shopify store.
Need help optimizing your Shopify product pages to reduce return rates, or want an expert to audit your current store for the specific changes that will move your numbers most? Get in touch with EcomFixify — we specialize in Shopify development and conversion rate optimization for growing brands.